Pump data interpretation using Tidepool

Warning

Objectives

To provide all users of Tidepool with a guide to interpreting the information provided by uploading pump data.

Scope


This document applies to all users of a pump within NHS Tayside that have registered with Tidepool and receive care via the Diabetes Out There (DOT) Tayside service.

Audience

Young people with diabetes within NHS Tayside and all health care professionals involved in their care.


Tidepool navigation

Tidepool basics tab
Basics tab
Tidepool trends tab
Trends tab
Tidepool daily tab
Daily tab
Tidepool device settings
Device settings

Glucose checks

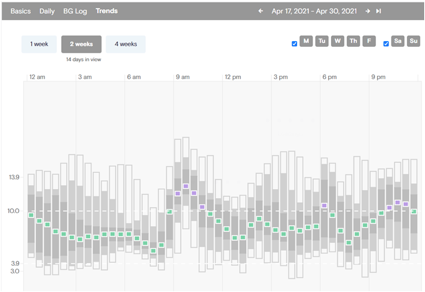
The number of glucose checks that you do will depend on whether you are fingerpricking for blood glucose, swiping your flash glucose sensor (FGS) or have a continuous glucose monitor (CGM).

Tidepool records any glucose value entered into your pump as a "BG reading", regardless of whether this is blood glucose (BG) or a value taken from FGS or CGM. This is displayed within the "Basics" tab.

Tidepool - BG readings

Aim for 5-7 readings per day.

If the average number of readings is less than 4, then there is not enough information to make any meaningful decisions.

Try to increase the number of blood glucose checks and repeat the upload in 2 weeks.

Number of boluses per day

When you are using pump therapy, you should aim to administer bolus insulin for all meals, all snacks and to correct glucose readings which are above target. Therefore we recommend aiming for at least 7 boluses per day.

Tidepool - average number of boluses per day

Set changes

We recommend set changes every 3 days or sooner if there is concern that insulin is not being delivered properly. If sets are kept in place for longer than this then the absorption of insulin from the site becomes less effective. This often leads to glucose readings above target. Remember to rotate your cannula sites. Repeated use of the same sites will lead to problems with insulin delivery.

Tidepool - infusion site changes

Pump suspends

These may occur intentionally, for example if a child has gone swimming or if a parent has temporarily stopped insulin delivery at the time of hypoglycaemia. For those families using a pump in conjunction with continuous glucose monitoring, the pump may suspend briefly due to predicted or actual hypoglycaemia.

Tidepool - suspends menu

Average daily insulin

The average daily insulin is also known as total daily dose of insulin (TDD). As children grow, they need more insulin. This is especially true around the time of puberty, when the body's hormones make an individual less sensitive to insulin.

Tidepool - average daily insulin ratio


Average daily insulin ratio

It is useful to look at the split between basal insulin (that which is delivered continuously by your pump), and bolus insulin (administered for food or as correction doses).

Usually between 30-40% is delivered as basal and around 60-70% as bolus. If you find the opposite, that the basal component is the higher %, then this can indicate too much reliance on basal insulin and that you or your child are forgetting some boluses.

Another potential indicator of missed boluses is if the average daily carbohydrate is lower than would be expected. The table below gives a useful guide which will apply to the majority of children:

Age Female (Carbs/ day) Male (Carbs/ day)
1-3 years 115g 125g
4-6 years 170g 185g
7-9 years 205g 220g
10-12 years 255g 270g
13-14 years 285g 315g
15-16 years 300g 360g
17-18 years 310g 390g

Average blood glucose

Tidepool displays blood glucose and sensor glucose readings (if applicable). Flip between the two by using the switch in the top right of the screen. Blood glucose readings are shown if BGM is selected, sensor readings are shown if CGM is selected.

Tidepool - BGM and CGM setting

BGM - aim for 8 mmol/l or less over a 2 week period if you are using intermittent fingerprick testing.
CGM - aim for 10mmol/l or less over a 2 week period if you are using a sensor.

For sensor glucose, we also recommend looking at average daily time in range (TIR = time spent between 3.9mmol/l and 10mmol/l). Your target should be to have TIR of above 70%, with time spent in hypoglycaemia less than 4%.

Glucose Management Indicator (GMI)

The GMI is an estimate of your child’s HbA1c based on the average glucose levels over 14 days or longer. The GMI can only be calculated in those children who are using continuous glucose monitors or flash glucose sensors with a high percentage of use.

Tidepool - sensor usage and GMI

If sensor usage is low, then there will be no GMI value displayed.

In Tidepool, the GMI is displayed as a percentage %, whereas in the UK we favour mmol/mol when discussing HBA1c. A GMI of less than 7.5% is equivalent to an HBA1c of less than 58mmol/mol and this is our clinic target. You can convert HbA1c from % to mmol/mol by using this online calculator.

Glucose trends

If you wear a sensor (flash or continuous), Tidepool shows you 30-minute segments that summarise the days in view. If you don't use a sensor then this graph will only display glucose readings that you have entered into your pump.

Tidepool - glucose trends graph

The graph shows the following:

  • Median. The green, purple, or red box toward the center of each 30-minute segment is your median glucose value for that part of the day. That shows you where the middle of your glucose range has been.
  • Half your readings. The darker grey above and below the median shows you where ½ of your glucose values have been.
  • Most of your readings. The lighter grey, in combination with the darker grey, shows you where most of your glucose values . Specifically, 80% of your glucose values for each 30-minute part of the day.
  • Tip: If you want to focus on these readings, uncheck the other boxes at the bottom (except “50% of Readings”).
  • Peaks and Valleys. Your highest highs and lowest lows generally are not trends, but they can highlight interesting events. The boxes at the top and bottom of the bar show you where highest 10% and lowest 10% of glucose values are. Use your mouse to hover one and reveal CGM traces.
  • Tip: If you want to see where you glucose values are most of the time, but ignore the highest highs and lowest lows, uncheck the “100% of Readings” checkbox at the bottom.

Variability

Variability in glucose checks is measured by standard deviation (SD) and/or coefficient of variation (CV). Both of these values are shown in the widget when looking "Trends".

Tidepool - glucose trends graph: variability measures

Interpreting variability

Standard deviation (SD) is a measure of variability. Somebody with lots of highs and lows may have an average glucose which looks ok, but have a high SD. Coefficient of variation (CV) is another way to consider variability which accounts for the average blood glucose and expresses variability as a percentage based on this average.

If there is a lot of variability then it makes it difficult to make sense of the numbers and to spot patterns. Making sensible changes to settings relies on spotting patterns.

You should aim for your SD to be about a third of your your average glucose (or less), or your CV to be less than 36%.

If your CV is over 50% then there is too much variability. Try to look for causes of this variability before changing anything else. Examples may include inaccurate carbohydrate counting, forgetting to change your sets or forgetting to bolus. Once you've identified a cause, try to address this and then repeat the upload after 2 weeks of readings.

ICR and ISF

Tips on checking insulin to carbohydrate ratio (ICR)

Look for patterns by reviewing the Trends tab or scrolling through days on the Daily tab. Changes are required if there is a pattern of high or low readings which recurs on most days after a mealtime bolus. If this is the case, then consider changing your device settings (see Bolus Insulin node within device settings).


Tips on checking the insulin correction/sensitivity factor

If a correction dose is given, the glucose should fall into the target range (4-7 mmol/l) 2 hours after the correction dose is given. If this is not the case, then consider changing your device settings (see Bolus Insulin node within device settings).

Tidepool - daily blood glucose graph with target range

Split boluses

Use of extended boluses can be viewed within the "Daily" tab. The bolus & carbohydrate panel shows boluses as blue bars. Click on any of the bars to see how much was delivered "up front" and how much was given over an extended time.

Tidepool - daily graphs: bolus and carbohydrate panel

Basal rate

The basal rate settings on you pump can be viewed by clicking on the "device settings" tab in the top right of the screen.

Tidepool - basal rate

Consider:

  • Number of basal patterns used - is another pattern required (e.g. for weekends)?
  • When adjusting basal rate, adjust the rate 2 hours before the desired effect on blood glucose.
  • Highest basal demands are at dawn and dusk.
  • Make adjustments according to total daily dose of insulin - see table below.
Total daily dose Adjust basal by
Less than 10 units per day 0.025 units per hour
10-20 units per day 0.05 units per hour
21-40 units per day 0.1 units per hour
41 units or more per day 0.2 units per hour

Bolus insulin

Within "device settings", look for carb ratios and insulin sensitivity (also known as correction factor).

Tidepool - bolus settings

Advice on changing insulin to carbohydrate ratio (ICR)

If you have found patterns of high or low readings on most days after a mealtime bolus (see Trends or Daily tabs), the consider changing your ICR. See table below for guidance:

Trend of BG 2 hours after the meal Action needed Suggested ratio change
High (More than 9mmol/L) Decrease the number of grams of carbs that 1 unit of insulin will cover 1:2→1:1.5 1:7→1:6 1:15→1:12 1:30→1:25
1:3→1:2 1:8→1:7 1:18→1:15 1:35→1:30
1:4→1:3 1:9→1:8 1:20→1:18 1:40→1:35
1:5→1:4 1:10→1:9 1:22→1:20 1:45→1:40
1:6→1:5 1:12→1:10 1:25→1:22 1:50→1:45
           
Low (Lower than 4 mmol/L) Increase the number of grams of carbs that 1 unit of insulin will cover 1:1.5→1:2 1:6→1:7 1:12→1:15 1:25→1:30
1:2→1:3 1:7→1:8 1:15→1:18 1:30→1:35
1:3→1:4 1:8→1:9 1:18→1:20 1:35→1:40
1:4→1:5 1:9→1:10 1:20→1:22 1:40→1:45
1:5→1:6 1:10→1:12 1:22→1:25 1:45→1:50

Tips on checking the insulin correction/sensitivity factor

If the glucose doesn't fall into the target range (4 to 7 mmol/l) 2 hours after a correction dose (see Daily tab) then consider changing your insulin sensitivity factor (ISF), also known as correction factor.

  • The programmed correction factor is how much we would anticipate 1 unit of insulin would lower your child’s glucose by.
  • Because small children have a low total daily dose of insulin, 1 extra unit would make a large change to their glucose. Small children therefore have a high degree of sensitivity to insulin and a high correction factor. For example, a correction factor of 8 means that 1 extra unit of insulin would be predicted to lower your child’s glucose by 8mmol/l.
  • Older children have a higher total daily dose and so are less sensitive to 1 extra unit of insulin. A correction factor of 2 may be more appropriate, meaning that 1 extra unit of insulin would be anticipated to lower their glucose by 2 mmol/l.
  • The required correction factor can be estimated using the sum: 100 divided by the total daily dose (TDD) of insulin. If the programmed correction factor is higher than the result of this sum, you may find that correction doses are not effective and therefore this should be adjusted.

Editorial Information

Last reviewed: 05/09/2023

Next review date: 05/09/2025

Author(s): Nicholas Conway.